Kamis, 30 Juni 2011

RIGHT WHALES DECODED

(Southern right whale. Credit: � Brian J. Skerry / National Geographic Stock. Via the World Wildlife Fund.)

An interesting new paper in MEPS (Marine Ecology Progress Series) on the southern right whales of New Zealand and Australia.

Background: All right whales, north and south, were taxed hard and early by human whalers�the "right" whales to hunt because their high blubber content made them likely to float after death and because they frequented near-shore waters.

That made them easy to get to even in the days of rowing.

(A painting, artist unknown, showing the hunting of right whales. La Baleine. The Whale, circa 1840. Credit: Wikimedia Commons.)

Some 150,000 Southern Hemisphere right whales (Eubalaena australis) were killed by 19th-century whalers and by illegal 20th-century Soviet whalers�driving the species to the brink of extinction.

Around Australia and New Zealand, hunting peaked in the 1830s-1840s, after which the species was commercially extinct.


(Geographic range of the southern right whale. Via the Red List.)

The latest IUCN estimate of southern right whales dates back to 1997 when they calculated a population of 7,500 individuals. 

At that time, several breeding populations (in Argentina/Brazil, South Africa, and Australia) showed evidence of strong recovery, with a doubling time of 10-12 years.

Which means there might be a fair few more than 7,500 whales today.


(Southern right whale with calf. Credit: John Atkinson. Via Marine Science Today.)

According to the authors of the MEPS paper, no right whales were seen in the waters around mainland New Zealand for 35 years between 1928 and 1963. A few slowly returned. Yet as recently as 2005 less than 12 sexually mature females were found there.

But another group, known as the New Zealand subantarctic group, has a more robust population estimated at about 936 whales today. Forebears of this group were likely present in some small numbers even in the bleakest killing years.


(Credit: E. Carroll, et al, via MEPS.)

The authors of the MEPS paper wondered about the levels of relatedness between those two whale stocks in New Zealand, as well as among whales in Australia.

They used mitochondrial DNA and microsatellite genotypes to identify 707 individual whales and test them for genetic differentiation. You can see the breakdown of that analysis in the graphic above.

Their data, combined with historical evidence, led the researchers to hypothesize that individuals from the NZ subantarctic are slowly recolonizing mainland New Zealand waters, where a calving ground was obliterated in the 19th century.


(Southern right whale. Via.)

The genetic evidence also suggests that the whales of southeast Australian are a remnant stock�different from the whales of southwest Australia:


At the onset of whaling, southern right whales, in particular cows with calves, were found across the southern coast of Australia during the austral winter (IWC 1986). There was no real discontinuity in distribution or catch records to suggest subdivision of calving grounds in this region (IWC 1986). Based on the timing of catches at shore whaling stations during the 19th century, Dawbin (1986) proposed that southern right whales undertook 2 distinct patterns of migration along the southern coast of Australia during the austral winter. The southern right whales that migrated north along the east coast of Tasmania [the small island off the southeast tip of Australia, as seen in the graphic above] moved in a northeasterly direction up the coast of Victoria and New South Wales, while those that migrated north along the west coast of Tasmania moved from east to west along the southern coast of South and Western Australia. The latter pattern is still extant, based on the movement of photo-identified southern right whales and has been termed the 'counter-clockwise' migratory pattern (Kemper et al. 1997, Burnell 2001).


(The Southern Ocean. Credit: Connormah via Wikimedia Commons.)

They also found evidence that New Zealand and Australian right whales mingle in higher-latitude summer feeding grounds each austral spring�making the health of those cold Southern Ocean waters as important a component of recovery as the whales' breeding efforts.

And what epic efforts they are. Imagine a 12-foot-long penis�known colloquially as a sea snake�plus a tons' worth of testes per male. Mating becomes a sport of endurance. And sperm competition.

But you don't have to imagine it. As usual, just for us, David Attenborough respects the privacy of none.


ResearchBlogging.org

Carroll, E., Patenaude, N., Alexander, A., Steel, D., Harcourt, R., Childerhouse, S., Smith, S., Bannister, J., Constantine, R., & Baker, C. (2011). Population structure and individual movement of southern right whales around New Zealand and Australia Marine Ecology Progress Series DOI: 10.3354/meps09145

Selasa, 28 Juni 2011

KLEPTOPARASITISM


Kleptoparasitism: 

klepto: Greek ???pt?? ("thief") and ???pt? ("steal") + parasitos: pa??s?t?? ("person who eats at the table of another")

Meaning: The parasitic theft of captured prey, nest material, etc., from animals of the same or another species; such as the theft by a gull* of a featherwight GoPro camera from a tourist on the French Riviera.

*Possibly a European herring gull (Larus argentatus).

(European herring gull. Credit: Kulac via Wikimedia Commons.)

The gull video reminded me of another wild travel video shot by a sea turtle on a "stolen" underwater camera.


The sea turtle video is more likely a case of entanglement than of kleptoparasitism.

Jumat, 17 Juni 2011

GLOW-IN-THE-DARK OCEAN


The images:

1) Firefly squid. Via.
2) Jellyfish. Via Flickr.
3) Ctenophore, Bathocyroe fosteri. Credit: Marsh Youngbluth via Wikimedia Commons.
4) Beroe ctenophore. Credit: Shane Anderson via NOAA.
5) Via.
6) Lanternfish, Lampanyctodes hectorisVia.
7) Comb jelly. Via.
8) Antarctic krill, Euphausia superba. Credit: Uwe Kils via Wikimedia Commons.
9) Via.
10) Via.
11) The final image in this sequence struck me as the single most amazing photograph I've yet seen on the Internet. Here's the Wikimedia Commons' page description:

ARABIAN SEA (Feb. 2, 2011) A Sailor stands watch on the fantail of the aircraft carrier USS Carl Vinson (CVN 70) as bioluminescent organisms and aircraft on final approach light the night around her. The Carl Vinson Carrier Strike Group is deployed supporting maritime security operations and theater security cooperation efforts in the U.S. 5th Fleet area of responsibility. (U.S. Navy photo by Mass Communication Specialist 2nd Class James R. Evans/Released)

Selasa, 14 Juni 2011

DNA OF A DEAD ZONE

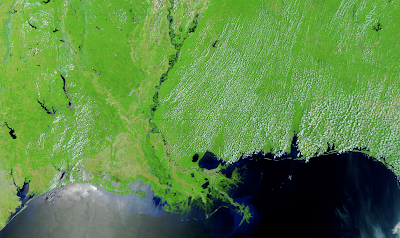
(The Gulf of Mexico. Credit: NASA.)

This year's hypoxia forecast forecast calls for the largest dead zone yet seen in the Gulf of Mexico. The report's just been released by the Louisiana Universities Marine Consortium, aka LUMCON:

This [dead] zone continues to threaten living resources including humans that depend on fish, shrimp and crabs. Excess nutrients, particularly nitrogen and phosphorus, cause huge algae blooms whose decomposition leads to oxygen distress and even organism death in the Gulf's richest waters.

I thought it might be interesting to take a look at the full lineage of this unfolding disaster�starting with the polar jet stream.


(Compare the position of the polar jet stream [purple] in these images of a typical El Ni�o and a La Ni�a, with the jet further south for La Ni�a. Credit: NOAA.) 

There's been an unusual La Ni�a-type jet stream dipping dip far south all through the spring. Jeff Masters at WunderBlog explains:

La Ni�a alters the path of the jet stream, making the predominant storm track in winter traverse the Midwest and avoid the South... La Ni�a's influence on the jet stream and U.S. weather typically fades in springtime... However, in 2011, the La Ni�a influence on U.S. weather stayed strong throughout spring... with wind speeds more typical of winter than spring... A series of strong storms moved along the jet stream and pulled up warm, moist Gulf of Mexico air, which mixed with the cold air spilling south from Canada.


(Sea surface temperature anomalies on 4 April 2011. Credit: NOAA.)

That collision of air masses spawned a lot of precipitation�particularly because of this year's warmer-than-normal waters in the Gulf of Mexico. Masters continues:

Sea surface temperatures (SSTs) in the Gulf of Mexico warmed to 1�C (1.8�F) above average during April�the third warmest temperatures in over a century of record keeping... These unusually warm surface waters allowed much more moisture than usual to evaporate into the air, resulting in unprecedented rains over the Midwest when the warm, moist air swirled into the unusually cold air spilling southwards from Canada. With the jet stream at exceptional winter-like strengths, the stage was also set for massive tornado outbreaks.


(Above: North Dakota, 12 Dec 2010. Below: swollen lower Mississippi River, 1 June 2011. Credit: NASA.)

In the two images above, taken six months apart, you can see how winter's heavy snows, pounded by spring's heavy snowmelts and ongoing heavy rains, changed the Mississippi landscape... and�ultimately�the seascape.


(Mississippi River sediment in the Gulf of Mexico. Credit: NASA.)

The problem�as I wrote earlier�is all the stuff in the floodwaters that isn't riverwater, namely fertilizers and other enrichers, like manure, which are the drivers behind the dead zone.

Put the weather, the floods, the farms, and the poo together and you get LUMCON's particularly gloomy hypoxia forecast:

The June 2011 forecast of the size of the hypoxic zone in the northern Gulf of Mexico for July 2011 is that it will cover between 22,253 to 26,515 km2 (average 24,400 km2; 9,421 mi2) of the bottom of the continental shelf off Louisiana and Texas. The predicted hypoxic area is about the size of the combined land area of New Jersey and Delaware, or the size of Lake Erie. The estimate is based on the May nitrogen loading (as nitrate+nitrite) from the Mississippi watershed to the Gulf of Mexico estimated by the U.S. Geological Survey. If the area of hypoxia becomes this large, then it will be the largest since systematic mapping of the hypoxic zone began in 1985.


(Long-term measured size of Gulf of Mexico hypoxic zone with 2011 forecast. Dark gray represents the range of ensemble forecast. Credit: Nancy Rabalais LUMCON/NOAA.)

Thus an initial problem with farmers incidentally fertilizing the ocean unto death is now compounded by a rapidly-shifting climate locked and loaded with unpredictable and wild extremes. As Jeff Masters writes:

One thing we can say is that since global ocean temperatures have warmed about 0.6�C (1�F) over the past 40 years, there is more moisture in the air to generate record flooding rains. The near-record warm Gulf of Mexico SSTs this April that led to record Ohio Valley rainfalls and the 100-year $5 billion+ flood on the Mississippi River would have been much harder to realize without global warming.


The growing dead zone would be slower to realize without global warming too... Another entanglement in the double helix connecting land to air to sea.

Sabtu, 11 Juni 2011

WHERE THE TURTLES ARE


This map gives a global snapshot of 1,167 nesting sites of the endangered green turtle (Chelonia mydas). The species boasts the largest nesting range of all sea turtles.

The map is also the grand-prize winner of this year's International Conservation Mapping Competition. Credit and kudos to Andrew DiMatteo, cartographer and database manager of the State of the World's Sea Turtles (SWOT) Project, and Associate in Research at Duke University. Kudos too to the hundreds of volunteers around the world who over a period of seven years shared their discoveries of nesting sites.

The map was first published in SWOT Report: The State of the World's Sea Turtles, Vol. 6. You can see completed SWOT maps for all sea turtle species here. And you can wend through other winners and notable contenders from the International Conservation Mapping Competition here.


(Green turtle hatchlings. From ScubaZoo.)

Kamis, 09 Juni 2011

DIVING BELL SPIDER SPINS A GILL


(Diving bell spider underwater inside its bubble gill where it retreats in oxygen-rich comfort to nosh. Via.)

The diving bell spider (Argyroneta aquatica) spends its life underwater�collecting air from the surface, carrying it below in the grasp of belly hairs, feeding it into a tiny sac woven of its own silk.

That much we've know for a while.

Now a new paper in the Journal of Experimental Biology describes how these air sacs are so much more than diving bells. They're also gills, drawing oxygen from the water:

After watching the spiders build their shimmering diving bells, the duo [Roger Seymour, Stefan Hetz] gingerly poked an oxygen sensing optode into the bubble to see how the animal reacted. Miraculously, the spider was unperturbed, so they continued recording the oxygen level. �Then it occurred to me that we could use the bubble as a respirometer,� says Seymour, to find out how much oxygen the spiders consume. Taking a series of oxygen measurements in the bubble and surrounding water, the team calculated the amount of oxygen flowing into the bubble before calculating the spider�s oxygen consumption rate and found that the diving bell could extract oxygen from the most stagnant water�even on a hot day. Also, the metabolic rate of the aquatic spider was low and similar to the low metabolic rates of other spiders that sit waiting for prey to pass... Calculating the diffusion rate of nitrogen out of the bubble, Seymour and Hetz were surprised to find that the spiders could sit tight for more than a day.

You can see how it all works in the video below, complete with techno spider ambient track.


ResearchBlogging.org

Knight, K. (2011). HOW THE WATER SPIDER USES ITS DIVING BELL Journal of Experimental Biology, 214 (13) DOI: 10.1242/jeb.060731

Rabu, 08 Juni 2011

HAPPY WORLD OCEAN DAY

(Weedy sea dragon, Phyllopteryx taeniolatus. Credit: Richard Ling, Rling via Wikimedia Commons.)

In case in the middle of an ordinary dry Wednesday you've forgotten how extraordinary is our ocean planet, here are a few watery reminders.


The Blue Ocean in RED from Howard Hall on Vimeo.


(Squid, possibly the bigfin reef squid, Sepioteuthis lessoniana. Credit:Nhobgood at Wikimedia Commons.)


MAYO / MAY from Rafa Herrero Massieu on Vimeo.


(Giant anemone, Condylactis gigantea. Credit:Nhobgood via Wikimedia Commons.)


Antarctica from Darek Sepiolo on Vimeo.


(Kelp. Credit: FASTILY via Wikimedia Commons.)


This new product released by Google Earth and developed by oceanographers at Columbia's Lamont-Doherty Earth Observatory promises a dynamic look through darkness to the seafloor. I confess, the extinct filmmaker in me wants to get my hands on this video and edit in some heft. But you can see how cool the perspectives are�how the new layers make Google Earth more oceanlike.

(Great white shark, Carcharodon carcharias. Credit: Pterantula via Wikimedia Commons.)

Selasa, 07 Juni 2011

TRACING JAPAN'S RADIOACTIVE OCEAN


(Japan. Credit: NASA.)

Japan's nuclear agency reported to the IAEA today that the nuclear fuel in three reactors at the Fukushima I Nuclear Power Plant likely melted through the inner containment vessels and not just their cores in the aftermath of the March 11th earthquake and tsunami.

Today's report also more than doubles the estimate of the amount of radioactive materials released�from 370,000 to 770,000 terabecquerels.


(Japan's damaged nuclear power plants in relation to the Tohoku earthquake and tsunami. Credit: Maximilian D�rrbecker / Chumwa via Wikimedia Commons.)

Which makes the work of a research cruise just now underway to measure radioactivity in the ocean off Japan even more important.  

The 15-day cruise is led by chief scientist Ken Buesseler of the Woods Hole Oceanographic Institution (WHOI) and members of his lab, Caf� Thorium. They're joined by researchers and technicians from around the world, including from the:


Other labs involved in the investigation:


(R/V Ka`imikai-o-Kanaloa. Credit: NOAA.)

The science crew of 17 is sailing aboard the research vessel Ka`imikai-o-Kanaloa�the Hawaiian name means Heavenly Searcher of the Sea�a vessel of the Hawaii Undersea Research Laboratory. Here's some of their onboard toolkit:

ADCP 
Acoustic Doppler Current Profiler (ADCP)
� Visit Website

Bongo Nets 
Bongo Nets
� Visit Website

ctd 
Conductivity, Temperature, Depth (CTD) Sensors
� Visit Website

Drifters 
Drifters
� Visit Website

Rosetter Sampler 
Rosette Sampler
� Visit Website


(Explosion at the Fukushima Nuclear Power Plant in the days following the Tohoku earthquake and tsunami. Via.)

The failures of engineering at Fukushima, combined with Japan's spectacular disaster unpreparedeness, resulted in the largest ever accidental release of radiation to the environment.

Much of the contamination washed into the Pacific. Additional airborne radioactivity likely further contaminated the ocean.

The team's mission statement:

The need to understand the amount, type, and fate of radioactive materials released prompted a group of scientists from the U.S., Japan, and Europe to organize the first multi-disciplinary, multi-institutional research cruise in the northwestern Pacific since the events of March and April. [We'll] spend two weeks... examining many of the physical, chemical, and biological characteristics of the ocean that either determine the fate of radioactivity in the water or that are potentially affected by radiation in the marine environment.

(Map of the trackline the ship will follow across an area 200x200 kilometers / 124x124 miles off Fukushima. White dots mark the sampling stations. Yellow and red mark the Kuroshio Current. Credit: Ken Buesseler, WHOI.)

As you can see from the image above, the team will be sampling well out into the mighty Kuroshio Current, a rich highway for the marine life of the North Pacific.

The isotopes/elements they're looking for:

  • iodine-131
  • cesium-137
  • plutonium
  • strontium
  • tritium

(Krill. Credit: �ystein Paulsen via Wikimedia Commons.)

Science Insider reports that marine biologist Nicholas Fisher from the State University of New York at Stony Brook is leading the effort to study how radioactivity wends its way through the marine foodweb:

Because 3 months have passed and most isotopes, particularly the short-lived iodine-131 with an 8-day half-life, have decayed considerably, he doesn't expect to see any toxicity. However, there will still be detectable levels in organisms such as brown seaweed, which can store iodine at 10,000 times the concentration in the water. Such a measure might help researchers understand how the isotopes move through the food chain, even up to seafood-eating humans.

(Via.)

Meanwhile Geoff Brumfiel & David Cyranoski at Nature News provide a great roundup of the ongoing challenges at Fukushima, including the ongoing grave reservations held by some researchers about the methods used:

[S]ome experts in Japan have expressed reservations about the decontamination process. Radioactive water will continue to flow from the cores into basements and trenches, and damage to the site means there will probably be further leaks. Ming Zhang, who studies environmental pollution risks at the National Institute of Advanced Industrial Science and Technology in Tsukuba, fears that contaminated water will end up in the ocean.

You can read blog updates from the Ka`imikai-o-Kanaloa cruise here.